

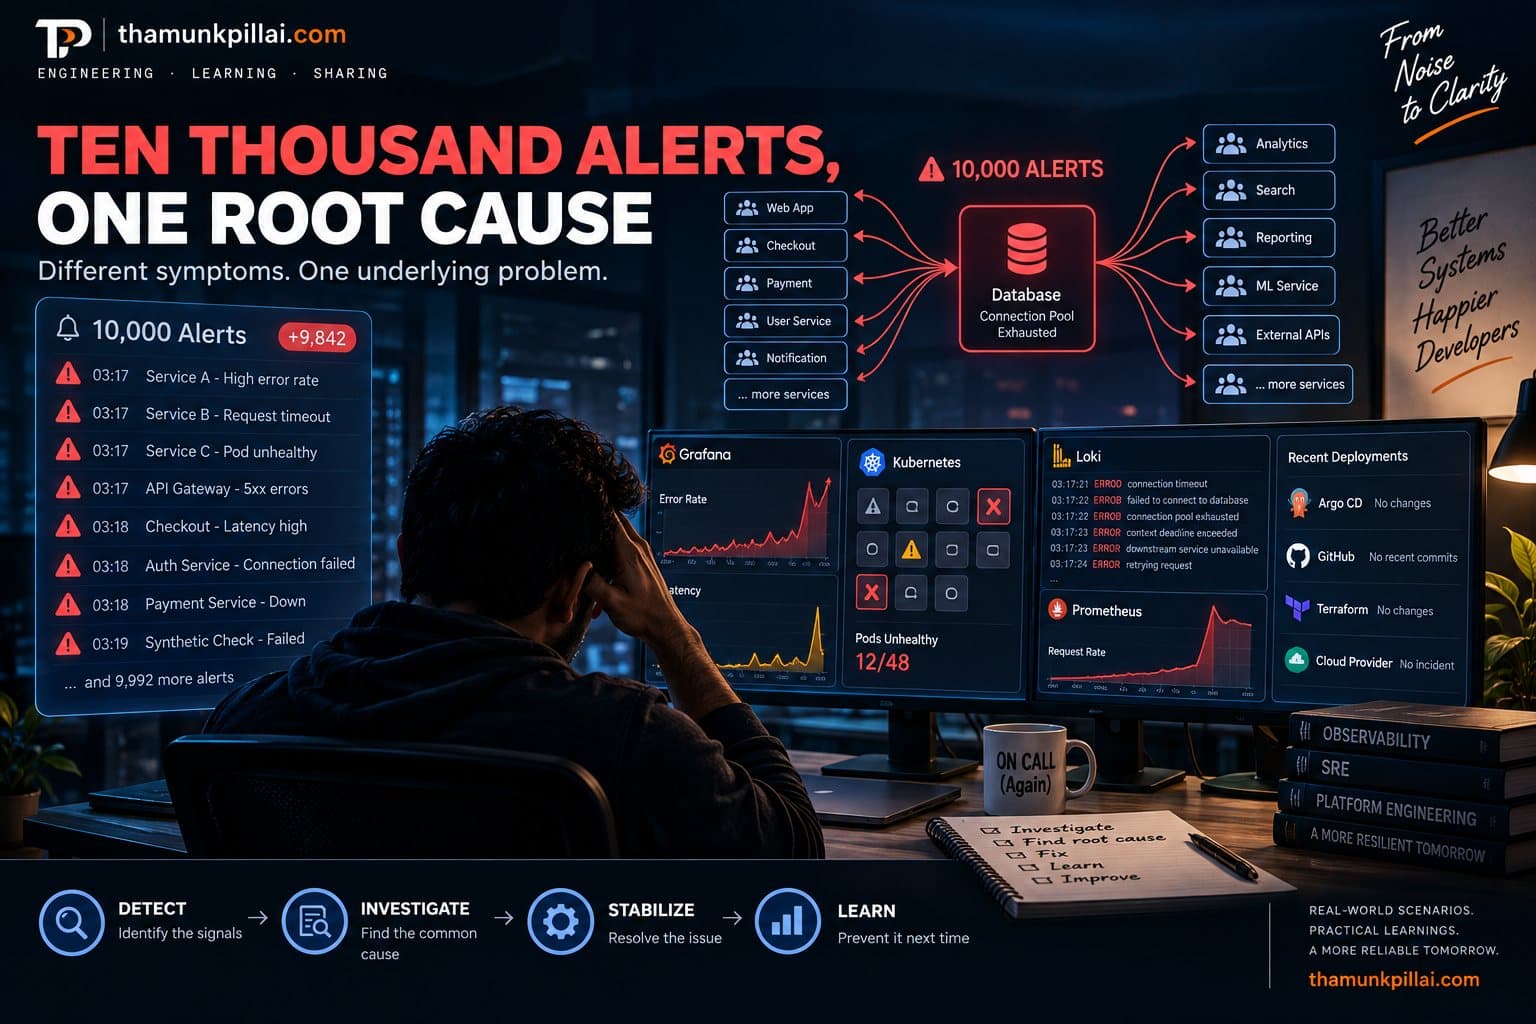
I haven't personally lived through the exact incident below — but I've seen enough of its shape in real systems that it's worth walking through as if I were the one holding the pager. So: if I were on call for this, here's how I'd actually work through it.
The environment
Assume a platform that looks roughly like this:
GitHub → CI/CD → Kubernetes → Services → PostgreSQL

Prometheus + Grafana  → metrics
Loki                  → logs
Tempo                 → traces
PagerDuty             → alerting
Nothing exotic. This is close to the default shape of a modern platform stack, which is exactly why the failure mode below is worth taking seriously — it isn't a contrived edge case.
What actually happens
PostgreSQL's connection pool runs out. Here's the chain that follows from that one fact:
PostgreSQL connection pool exhausted
        ↓
Service A starts timing out
        ↓
Service B retries (adding load, not relieving it)
        ↓
Service C gets slower
        ↓
Kubernetes health checks start failing
        ↓
Latency SLOs breach
        ↓
Synthetic monitoring fails
        ↓
2,847 alerts, and climbing
One fact at the top. Eight layers of legitimate, correctly-configured monitoring below it, each one accurately reporting that something in its scope is wrong. None of them individually wrong. Collectively, useless without a way to see that they share a root.
Opening PagerDuty
I open PagerDuty and see 2,847 alerts. My first move isn't to start opening them one by one — at that volume, reading each alert is a way to feel busy, not a way to find the cause.
Instead, I'd look at the incident timeline and ask one question first: what changed immediately before the alerts started? Then move through the signals in order, not because every tool is equally likely to have the answer, but because this order goes from "what changed" to "where did it break" to "who touched anything recently":
- Grafana — is there a common spike across dashboards, and when does it start?
- Prometheus — which metric moved first, not which metric is reddest right now?
- Kubernetes — are pods and nodes actually unhealthy, or are they healthy and just can't reach something?
- Loki — is the same error signature showing up across multiple, otherwise-unrelated services?
- Tempo / Jaeger — when a request fails, where in the trace does it actually fail?
- Argo CD — was there a deployment in the window that matters?
- Cloud provider status — is this actually a dependency-level incident that isn't ours to fix?
By the time I've gone through that list, I'm not looking at 2,847 alerts anymore. I'm looking for the first abnormal signal that explains the rest of them.
Note
The volume was never the real problem. Every threshold fired correctly — each one detected that its own metric crossed a line. What was missing wasn't better thresholds. It was something above them that understood a few thousand crossed lines could share one cause.
What I'd do
- Stop the noise. Acknowledge the incident and establish, quickly, whether this is one incident or several unrelated ones wearing the same timestamp. Don't try to fix anything until this is settled.
- Find the earliest signal, not the loudest one. The alert with the scariest name is rarely the one that started the chain. Sort by time, not severity.
- Check the dependency graph. If thirty services are failing but they all sit downstream of the same database, that's one problem wearing thirty costumes — a fundamentally different situation than thirty independent failures, and it changes everything about where I look next.
- Check what actually changed. Git commits, CI/CD runs, Argo CD syncs, Terraform applies, Kubernetes config changes, feature flags. Most incidents that look mysterious have a boring, recent change sitting somewhere in this list.
- Form a hypothesis, out loud. Something like: "It looks like the database connection pool exhausted around 03:16, and everything downstream started failing within about forty seconds of that." A hypothesis is falsifiable — the next step is checking whether the evidence actually supports it, not acting on it blind.
- Stabilize, deliberately. Roll back a bad deploy, shed load, scale the affected service, fail over, disable a feature flag, apply an already-approved mitigation. Whatever it is, it should follow from the hypothesis, not from a general instinct to poke the unhealthy-looking thing.
What I wouldn't do
- ❌ Restart every unhealthy pod. Restarting can mask the evidence you need to actually understand what happened.
- ❌ Ask an AI agent to automatically fix everything with no human checkpoint.
- ❌ Give an AI agent unrestricted production access mid-incident.
- ❌ Treat every one of the 2,847 alerts as its own incident.
- ❌ Change five things at once before the hypothesis is confirmed.
That last one matters more than it sounds. Change five things at once and you might recover the system — and lose any ability to explain what actually happened. A recovered system with an unexplained cause isn't a resolved incident. It's a deferred one, and it comes back.
Where AI actually helps
Not by summarizing 2,847 raw alerts faster than a human could scroll through them — that's automating the wrong step. It helps once it has the same structured evidence a competent on-call engineer would gather: the alert cluster, the service topology, recent deploys, logs, metrics, traces, and the relevant runbooks.
Given that, I could ask something concrete: "What changed before this incident, which services are affected, and what's the most likely root cause? Show me the evidence."
A well-grounded agent, working from that evidence, might come back with something like:
Likely cause: database connection pool exhaustion
Confidence: High

Evidence:
- Connection utilization increased sharply at 03:16
- Service timeouts began ~40s later, consistent with pool wait time
- Multiple downstream services show the same failure signature
- No application deployments occurred in the incident window
That's the actual value: not replacing the judgment call, but collapsing the time between "2,847 alerts" and "one testable hypothesis with evidence attached" from twenty minutes of scrolling to about the length of one query. The engineer still forms the final call, still decides how to stabilize, still owns the postmortem. The agent just did the tedious cross-referencing that used to eat the first third of every incident.
My takeaway
One thing I keep coming back to with these scenarios: AI shouldn't be the first answer to operational complexity. If an observability system produces 2,847 alerts for one failure, I don't want to build a smarter way to read 2,847 alerts. I'd rather fix whatever let one failure fan out into 2,847 alerts in the first place — then hand the resulting agent structured signals, topology, and history, so it can help the engineer investigate faster once there's something worth investigating.
Fix the noise first. Add intelligence second.
— Thamo