"How many lines of code did you write today?" is the question a manager asks when they don't actually have a way to measure productivity. It's also, reliably, the wrong question — lines of code, commit count, and hours worked all measure activity, and activity is not the same thing as value delivered. Yesterday's article named developer satisfaction and adoption as things a platform product manager watches; today's article is about measuring the thing those numbers are really a proxy for: whether developers can actually ship value without friction.
Note
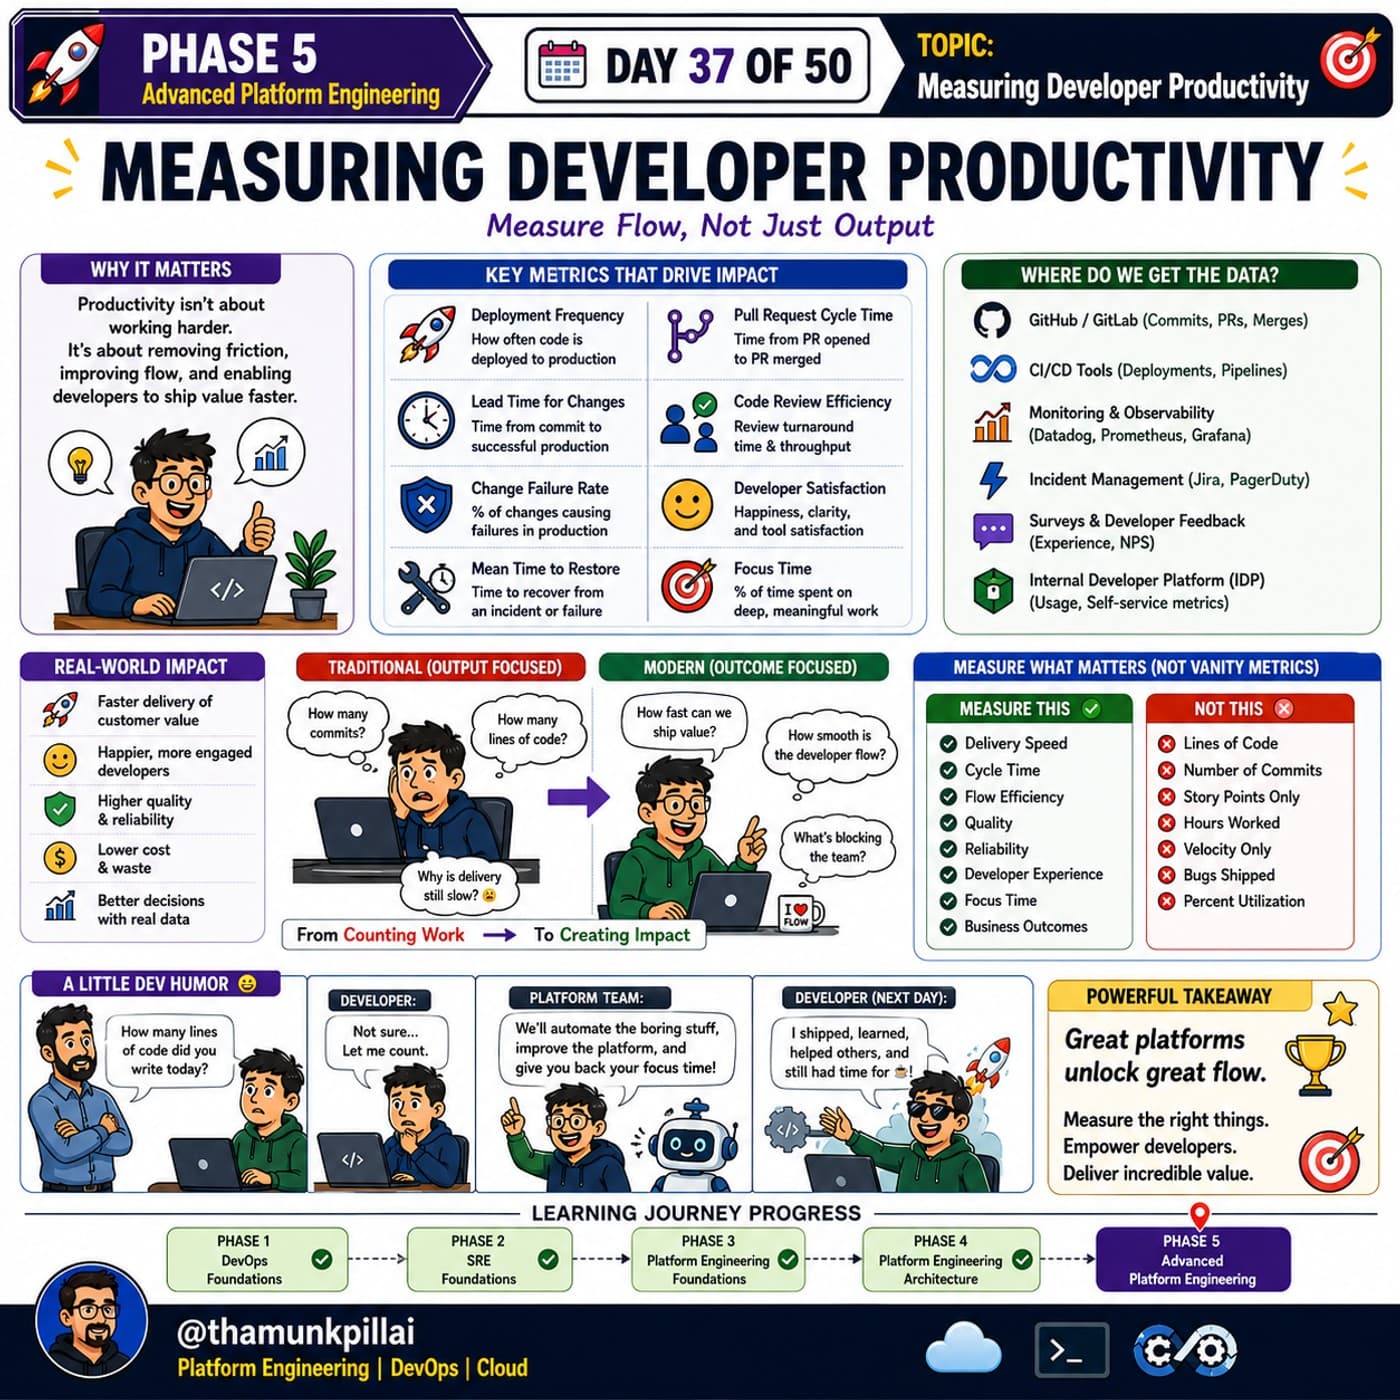
The reframe this whole article rests on: productivity isn't about working harder. It's about removing friction, improving flow, and enabling developers to ship value faster. A team that "worked harder" by that old definition and still shipped nothing of value hasn't been productive — it's been busy.
Two different sets of metrics, two different mental models
TRADITIONAL (output-focused)        MODERN (outcome-focused)
"How many commits?"                  "How fast can we ship value?"
"How many lines of code?"            "How smooth is the developer flow?"
                                      "What's blocking the team?"

From Counting Work → To Creating Impact
The traditional column isn't wrong because the numbers are fake — commits and lines of code are real, measurable things. It's wrong because none of them correlate reliably with the thing an organization actually wants, which is value reaching users. A developer can write a thousand lines fixing a problem better solved by deleting a hundred; the traditional metrics would call that a bad day.
The metrics that actually drive impact
| Metric | What it measures |
|---|---|
| Deployment frequency | How often code is deployed to production |
| Lead time for changes | Time from commit to successful production release |
| Change failure rate | Percentage of changes causing production failures |
| Mean time to restore | Time to recover from an incident or failure |
| Pull request cycle time | Time from PR opened to PR merged |
| Code review efficiency | Review turnaround time and throughput |
| Developer satisfaction | Happiness, clarity, and tool satisfaction |
| Focus time | Percentage of time spent on deep, meaningful work |
The first four of these are the DORA metrics — a well-established, industry-standard set specifically because they measure the system's throughput and stability, not any individual's activity. Notice none of them can be gamed by one developer typing more; they're properties of the whole pipeline from commit to production, which is exactly the pipeline this series has spent thirty-six days describing.
What to measure, and the specific list to avoid
MEASURE THIS                        NOT THIS
✓ Delivery speed                    ✗ Lines of code
✓ Cycle time                        ✗ Number of commits
✓ Flow efficiency                   ✗ Story points only
✓ Quality                           ✗ Hours worked
✓ Reliability                       ✗ Velocity only
✓ Developer experience              ✗ Bugs shipped
✓ Focus time                        ✗ Percent utilization
✓ Business outcomes                 ✗
"Percent utilization" deserves a specific callout, because it's the metric most likely to actively damage a team if optimized for directly. A team running at 100% utilization has no slack to absorb the unplanned work every real system generates — incidents, urgent requests, blocked dependencies — and ends up with the worst possible flow efficiency despite looking maximally "productive" on paper.
Where the data actually comes from
GitHub/GitLab (commits, PRs, merges) · CI/CD tools (deployments, pipelines)
Monitoring & observability (Datadog, Prometheus, Grafana — Day 32's stack)
Incident management (Jira, PagerDuty) · Surveys & developer feedback (NPS)
Internal Developer Platform usage (self-service metrics — Day 24's system)
Every one of these sources already exists in a team running the practices this series has covered — nothing here requires new tooling, only pointing existing systems at a different question. This is also why Day 32's platform observability and Day 24's self-service usage data turn out to double as productivity data: the platform's own telemetry is the productivity measurement system, not a separate initiative layered on top.
The dev-humor version of the whole article
"How many lines of code did you write today?" / "Not sure... let me count." / "We'll automate the boring stuff, improve the platform, and give you back your focus time." / "I shipped, learned, helped others, and still had time for coffee." That arc — from counting lines to protecting focus time — is the entire shift this article is arguing for, compressed into one exchange.
The takeaway, and where it points next
"Great platforms unlock great flow. Measure the right things. Empower developers. Deliver incredible value." That's the through-line connecting this article back to everything since Day 20: a platform's entire justification is removing friction from delivery, and the metrics in this article are simply how you verify that's actually happening rather than assuming it. Tomorrow's article narrows from developer productivity broadly to a more specific number: platform adoption itself, and why a platform nobody uses can have excellent DORA metrics for the ten people still using the old way, and still be failing completely.